CND header

AIA Home > SBSE Home > Teaching Resources > Carbon Neutral Design > Carbon Neutral Teaching > La Roche - Origin Of Carbon Emissions for Housing in Different Climates

arrow Project Introduction

arrow What is Carbon Neutral Design?

arrow Carbon Neutral Design Process

arrow Carbon Neutral Design Strategies

arrow Carbon Calculation Protocols

arrow Carbon Calculation Tools

arrow Carbon Neutral Case Studies

arrow Carbon Neutral Teaching

Curriculum Projects Overview

Projects (by professor):

> Bagneid
> Boake
> Chalfoun
> Demers + Potvin
> Elzeyadi
> Guzowski
> Haglund
> Kaiser
dot La Roche
Geographical Distribution of Carbon Emissions
Origin Of Carbon Emissions for Housing in Different Climates
Solar Site Analysis
Radiation Impact on Surfaces
Fenestration and Shading
Daylight Analysis
Air Flow Analysis
Analysis of Carbon Calculators

> Peña
> Rashed-Ali
> Shaviv + Yezioro
> Stannard
> Theis
> Thomson

Projects (by teaching topic):
visit this link to see the projects sorted by the carbon related topic

> Frameworks and Goals
> Site
> Building Form / Integrated Design Overview
> Envelope
> Passive Strategies
> Efficient Mechanical Strategies
> Energy
> Materials
> Water
> Miscellaneous Related Topics
> Integrated Topics

arrow Resources

arrow Links

AIA AIA
 
The Carbon Neutral Design Project:
Carbon Neutral Teaching: Curriculum Materials Development
Pablo La Roche
California Polytechnic State University

Fall 2007, 2008 graduate/undergraduate elective ‘Topics Studio’

Origin Of Carbon Emissions for Housing in Different Climates

California carbon

Design Performance Objective

Building CO2 Emissions by Sub Area

California

Student: xxx

Software/Tools:

Fall 2007, 2008 graduate/undergraduate elective ‘Topics Studio’

Origin Of Carbon Emissions for Housing in Different Climates

Determine origins of energy use and CO2 emissions for a representative 1500 ft2 code compliant house. This house will represent a typical energy code compliant house, and the calculation is done in two climate zones. This house will be used as the base case for comparison with student projects developed during the studio. This assignment will help the student gain a better understanding of the relationship between the sources of carbon emissions in homes, local climate and energy use in that specific climate. Emphasis is on emissions from operational energy. Transportation to and from the building, providing water to the building, disposing of waste from the building and construction of the building are not analyzed in this base case in 2007. They are analyzed in another exercise in 2008.


Investigative Strategy

Energy modeling software is used to determine the energy consumption and CO2 emissions for the typical code compliant house in each climate zone. In this exercise two climate zones were selected, only one of which is presented here.

1. Energy Consumption and CO2 emissions in the reference house.

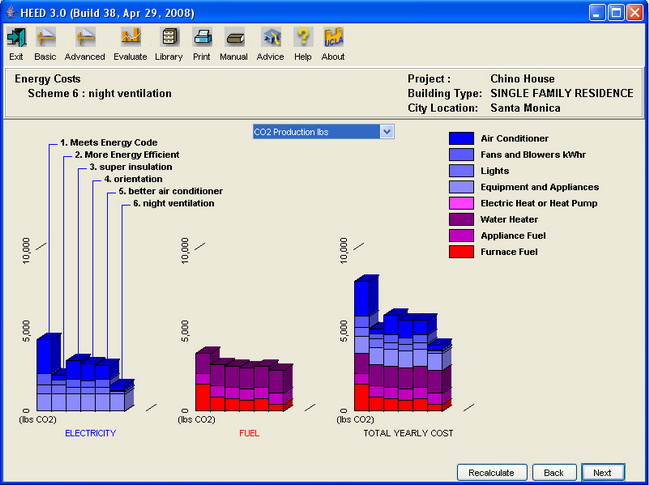
1.1. Energy modeling of the reference house with Home Energy Designer as indicated in the previous technique “geographical distribution of carbon emissions” and HEED. Both of these permit to determine the total energy consumption and their origins. In HEED this is done using the energy costs screen (Fig 1). This screen presents the results in units of energy and carbon emissions for air conditioning, fans and blowers, lights, equipment and appliances, electric heat or pumps, water heater, appliance fuel and furnace fuel.

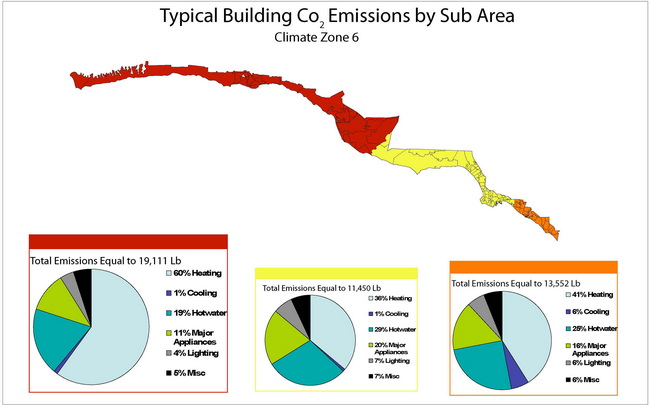
1.2. Use Home Energy Saver to determine total energy consumption and their origin in the different zip codes. This is done using the results screen: heating, cooling, hot water, lighting, major appliances, miscellaneous.

1.3. Determine combinations of climate zones and zip codes with similar energy use patterns (Fig. 3). This will permit them to be compared with climate design strategies that would reduce the building’s carbon footprint.

2.Climate Analysis
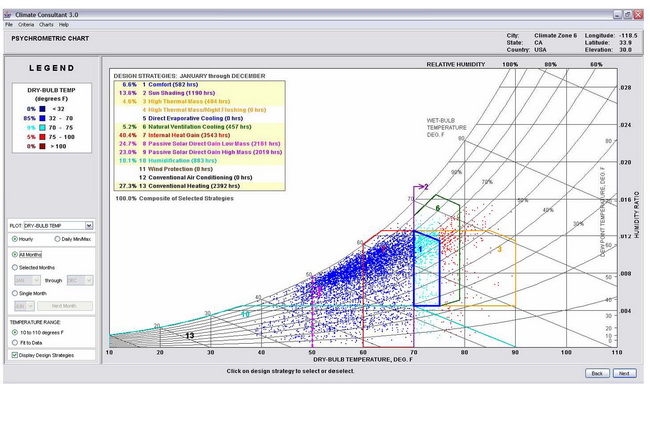
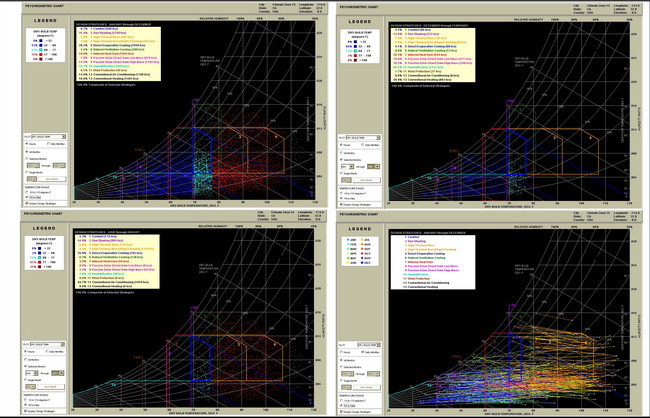
2.1. Use Climate Consultant or the Weather Tool to determine design strategies that could be incorporated in the design of the house to reduce energy use and CO2 emissions. Traditionally climate analysis is done before any type of modeling is done. In this case it was done after the energy analysis to determine strategies that could reduce the emissions factors from the different sources detected in 1.

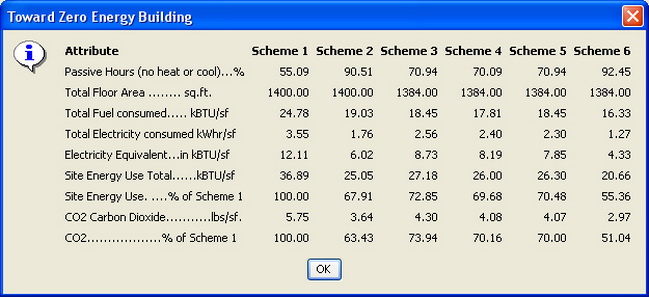
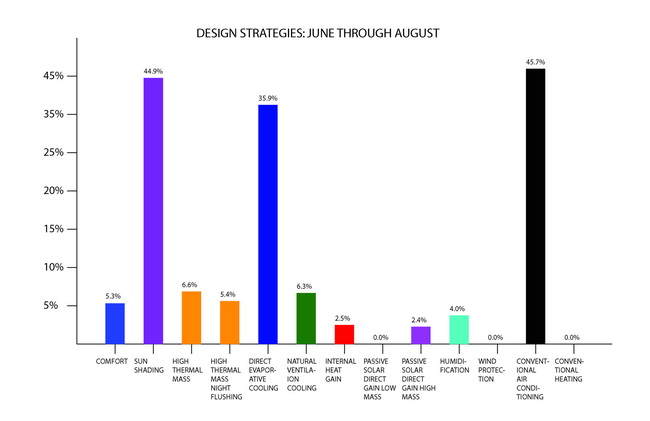
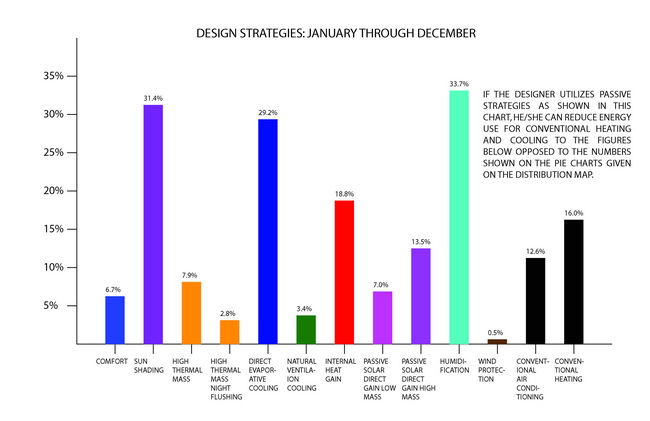
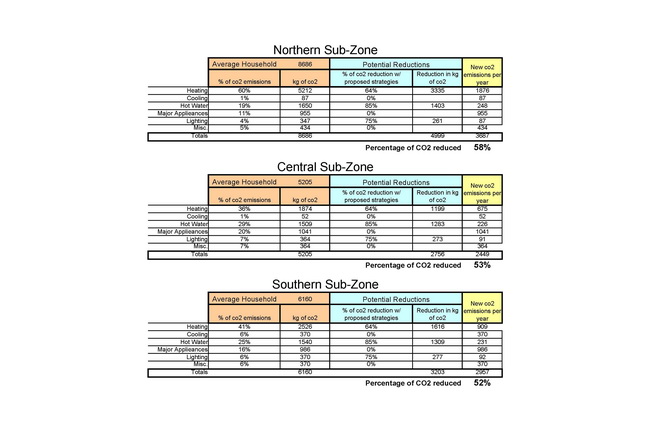
2.2. Rank the potential impact and performance of these strategies. This can be graphed for the heating and cooling seasons separately (Fig 5, 6). The strategies can be organized in tables that indicate potential CO2 reductions after implementing them (Fig 7).

Evaluation Process
Class discussions and presentations of the maps and the information to the other teams. Students must find relationships between CO2 emissions, the origin of these emissions in the buildings, and climate in which these buildings are located.
Information about the Project and Studio

• course outline

• project outline

Evaluative Criteria
Students should be able to slect and rank the strategies.
Cautions/Possible Confusions
Calculations should be checked several times. There are many opportunities for errors in this process.
Range of Applicability in terms of CLIMATE
This type of exercise is valuable for all climate zones but should be noted to produce different results for various locations.
Range of Applicability in terms of TYPE
This can be used for any building type.
Reference Material

HEED web http://www2.aud.ucla.edu/energy-design-tools/
Climate Consultant http://apps1.eere.energy.gov/buildings/tools_directory/software.cfm/ID=
123/pagename_menu=mac/pagename=platforms

Title 24 maps:
http://www.energy.ca.gov/maps/building_climate_zones.html
http://hes.lbl.gov/gazetteer/places2k.html

P. Torcellini, S Pless, M Deru, D Crawley. Zero Energy Buildings: A Critical Look at the Definition. ACEE, Summer Study, Pacific Grove CA (2006).

A Green Vitruvius. Principles and Practice of Sustainable Architectural Design. European Commission, Directorate General XVII For Energy (2001).

Plea Note 6, Keeping Cool: Principles to Avoid Overheating in Buildings. La Roche, P., Quirós, C., Bravo, G., Machado, M., Gonzalez G., (2001). Kangaroo Valley, Australia: Passive Low Energy Architecture Association & Research Consulting and Communications, 60 p.

Duration of Exercise
One week
Degree of Difficulty / Previous Knowledge Required
Medium
 

HEED screenshot

Screenshot from HEED

Screenshot from HEED

Screenshot from HEED

Psychrometric Chart
Psychrometric Chart for California Climate Zone 8 created with Climate Consultant

Psychrometric Chart for California Climate Zone 8 created with Climate Consultant

Strategies

Design Strategies June through August as suggested from the Psychrometric Chart

Design Strategies January through December as suggested from the Psychrometric Chart


©2012 American Institute of Architects | Society of Building Science Educators | Legal Disclaimer