CND header

AIA Home > SBSE Home > Teaching Resources > Carbon Neutral Design > Carbon Neutral Teaching > La Roche - Geographical Distribution of Carbon Emissions

arrow Project Introduction

arrow What is Carbon Neutral Design?

arrow Carbon Neutral Design Process

arrow Carbon Neutral Design Strategies

arrow Carbon Calculation Protocols

arrow Carbon Calculation Tools

arrow Carbon Neutral Case Studies

arrow Carbon Neutral Teaching

Curriculum Projects Overview

Projects (by professor):

> Bagneid
> Boake
> Chalfoun
> Demers + Potvin
> Elzeyadi
> Guzowski
> Haglund
> Kaiser
dot La Roche
Geographical Distribution of Carbon Emissions
Origin Of Carbon Emissions for Housing in Different Climates
Solar Site Analysis
Radiation Impact on Surfaces
Fenestration and Shading
Daylight Analysis
Air Flow Analysis
Analysis of Carbon Calculators

> Peña
> Rashed-Ali
> Shaviv + Yezioro
> Stannard
> Theis
> Thomson

Projects (by teaching topic):
visit this link to see the projects sorted by the carbon related topic

> Frameworks and Goals
> Site
> Building Form / Integrated Design Overview
> Envelope
> Passive Strategies
> Efficient Mechanical Strategies
> Energy
> Materials
> Water
> Miscellaneous Related Topics
> Integrated Topics

arrow Resources

arrow Links

AIA AIA
 
The Carbon Neutral Design Project:
Carbon Neutral Teaching: Curriculum Materials Development
Pablo La Roche
California Polytechnic State University

Fall 2007, 2008 graduate/undergraduate elective ‘Topics Studio’

Geographical Distribution of Carbon Emissions

California Carbon

Design Performance Objective

Carbon Emission Analysis

Students that worked in this exercise and are responsible for all the images:
Serge Mayer, Ryan Cook, Marcos Garcia, John Duong, Ryan Hansanuwat, Nick Pieroti, John Gayomail, Greg Ladjimi, Brandon Gulloti, Garrett Van Leeuwen.

Software/Tools:

Home Energy Saver

Fall 2007, 2008 graduate/undergraduate elective ‘Topics Studio’

Geographical Distribution of Carbon Emissions

Students are not used to visualizing amounts of CO2. It is important that they learn to think and visualize in units of carbon just as they can think in units of length, width and space. This exercise will help the student to visualize CO2 emissions per units of dwellings.

The students had to determine residential yearly CO2 emissions in zip codes located in different climate zones. This exercise will help students achieve an understanding of the relationship between carbon emissions, climate and population density.

Investigative Strategy

The students work in teams to analyze CO2 emissions in several climate zones using a method developed in class. The method begins by determining the extent of the climate zones and the zip codes located in each zone. Energy use and CO2 emissions for a typical home in each zone are determined and maps are generated with this information. The next exercise compares this information with potential CO2 reducing strategies.

1. Climate Zones and Zip Codes

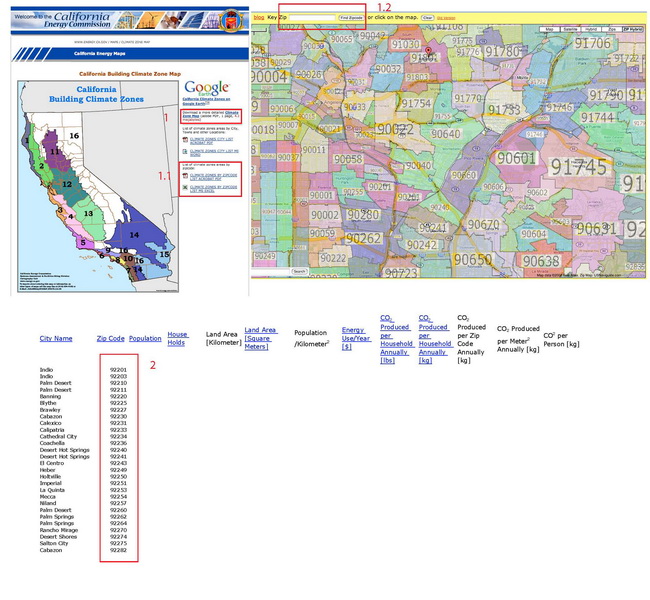
1.1. The students define the boundaries of the climate zones and determine the zip codes in each climate zone. For this project California Climate zones were used, so the limits and the zip codes inside the zone were previously defined.

1.2. Determine which zip codes are in the climate zone under study.

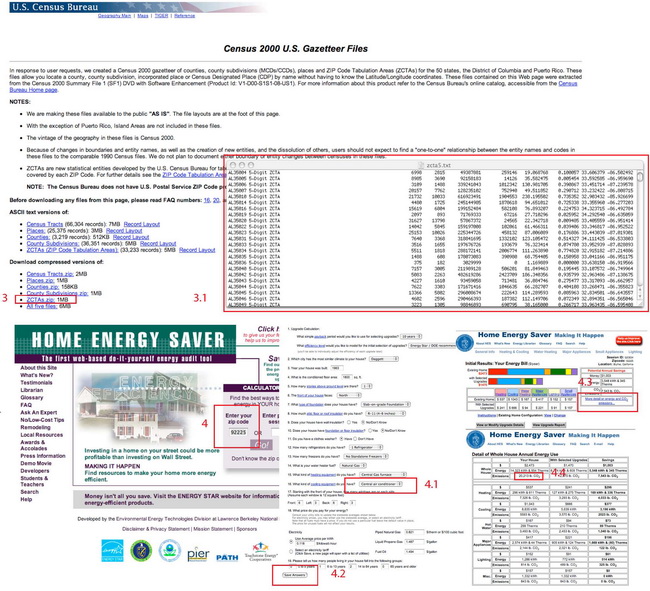
1.3. Gather census data from website
http://www.census.gov./geo/www/gazetteer/places2k.html

1.4. Use the following information from the census files. This is organized in a spreadsheet in the following columns:
•City name [A]
•Zip code [B]
•Population [C]
•Households [D]
•Land area (square miles) [E]
•Land area (square meters) [F]

2. Determine Residential Energy use and CO2 emissions per Zip Code
Determine energy and CO2 emissions for a reference house in each zip code in the climate zone.

Then multiply CO2 and energy per dwelling by the number of units in each zip code. Several energy modeling programs can be used to determine energy and emissions. Home Energy Saver has been used in this exercise and the calculation is done in the following form (numbers correspond with numbers in figures):

2.1. Go to Home Energy Saver Site:
http://hes.lbl.gov

2.2. Enter zip code

2.3. Set cooling to “central air”
•Save answer
•Calculate

2.4. Select link “more details...”
Columns
•Energy use/money per year [G]
•Price per KwHr [H]

2.5. The estimated CO2 emissions for the house are indicated in the website.

3. Determine CO2 emissions in the zip code.
Select the CO2 per household obtained in 2.5 for each zip code and multiply by the number of households per zip code.

•CO2 (kg) per household annually [I]
•CO2 (kg) per household annually [J]
•CO2 (kg) per zip code annually [K]
G x C = H
•CO2 (kg) / m2 annually [L]
H/D
•Lbs/ft2 of CO2 annually [M]
(H x 2.2)/(D x 10.7636)
•Lbs of CO2 per person [N]
(H x 2.2)/B

4. Generate Maps with this Information.
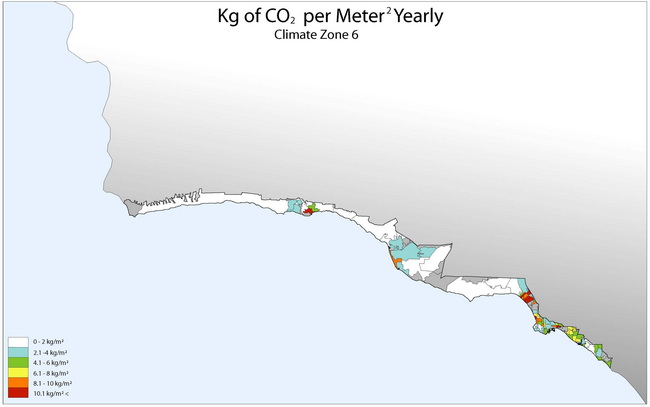
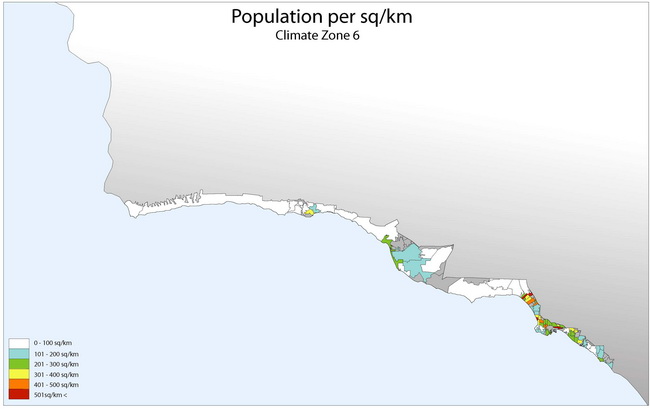
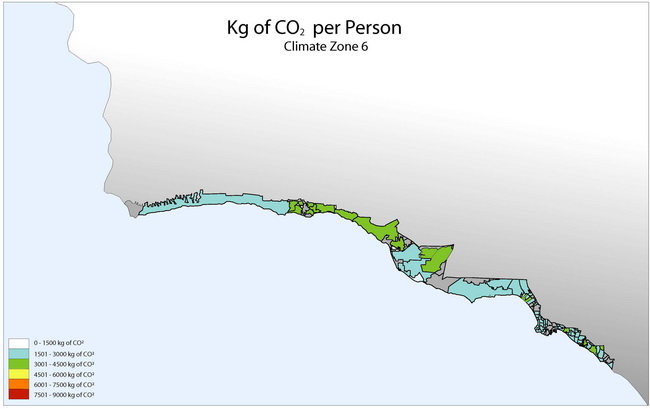
Emphasis is on creating maps that help to understand the relationships between emissions and population density and emissions with surface areas. GIS would help create these maps (Figs 4,5,6) but they can also be drawn by hand (as these have been).

Residential CO2 in kg/m2 per year
Residential CO2 in kg/person per year
Population per square kilometer

Evaluation Process
Class discussions and presentations of the maps and the information to the other teams.
Information about the Project and Studio

• course outline

• project outline

Evaluative Criteria
Students must find relationships between CO2 emissions, population density and climate. Some relationships such as density and CO2 are easy to understand, but they are sometimes affected by land use. The next project addresses the origin (residential) of these emissions.
Cautions/Possible Confusions
Calculations should be checked several times because there are many opportunities for errors in this process.
Range of Applicability in terms of CLIMATE
This type of exercise is valuable for all climate zones but should be noted to produce different results for various locations.
Range of Applicability in terms of TYPE
This can be used for any building type.
Reference Material
Duration of Exercise
One week
Degree of Difficulty / Previous Knowledge Required
Difficult
 

Home Energy California


California


California


California


©2012 American Institute of Architects | Society of Building Science Educators | Legal Disclaimer